Performance
The theme dashboard provides the ability to review and optimize real user experience. This tool lets you dive into your store's performance based on three categories: speed, stability, and interactivity. These categories are Google’s widely adopted Core Web Vitals and replace the old Speed Score.

We’re going to walk through what these numbers mean and give you some tools to get the most performance out of your online store.
"My scores aren't good!"
Although performance is an important consideration, don’t be too alarmed if you have low dashboard scores. Consider this: a store with no features or media will likely have perfect performance scores and sell nothing, while the world’s most successful brands will often have high conversion rates but varying performance scores.
The most successful storefronts balance a mix of features and media that keeps potential customers engaged and moving through the purchasing funnel. In particular, ensuring performance is highest when your potential customer first visits your store, and adding features to drive a conversion when they express more interest—such as on the product page.
Improving your theme's performance is a joint venture between Shopify, us at Troop Themes and you as they rely on many factors across each stakeholder.
Speed Score vs. Core Web Vitals
Google introduced Core Web Vitals to help measure and improve user experience. These metrics provide a standard way to measure and optimize user experience. Using real user data, they are more representative of actual performance. Scoring well in web vitals feeds into better SEO results as well as higher conversion rates.
The previous Speed Score used a single Lighthouse score to assess site performance. But, Lighthouse’s scoring criteria have their limitations. They fail to represent real-world user experiences, leading to confusion and frustration. Shopify recognized this problem and created a solution that overcomes these limitations.
The new web performance dashboard captures actual interactions and experiences from real users. This provides a fuller understanding of how your website performs in the real world. This includes all the variations of connection types, device types, locations and browsers.
How to interpret the dashboard
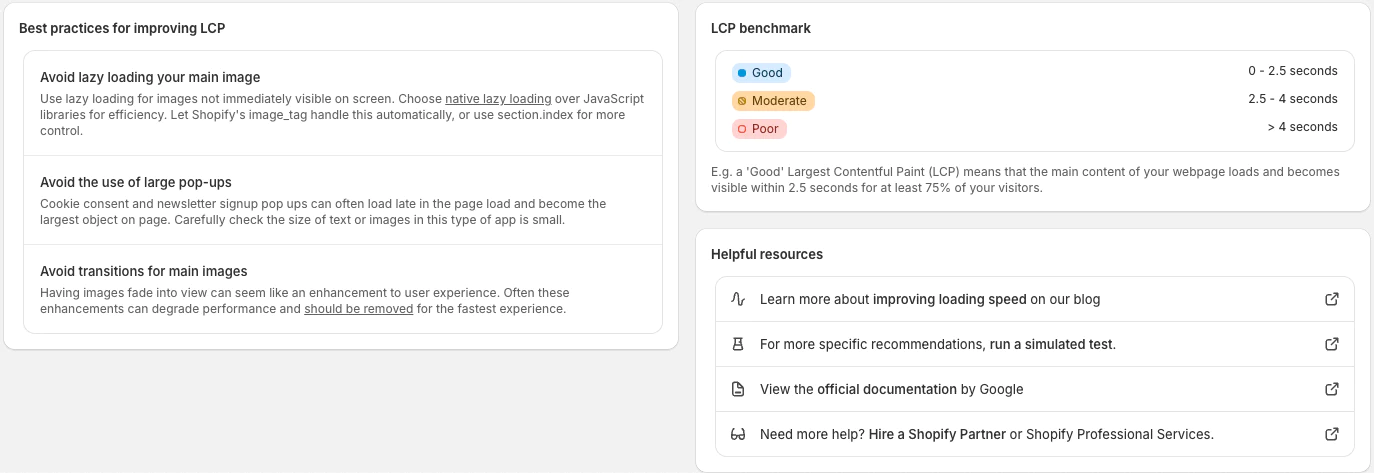
- Loading Speed represents how fast the page loads for the user. This is often measured as Largest Contentful Paint (LCP)
- Interactivity represents how responsive the site is when a user interacts with it. Often referred to First Input Delay (FID)
- Visual Stability represents how smooth the page loads, avoiding sections jumping around. AKA Cumulative Layout Shift (CLS)
Any rating that is not marked as "good" represents an opportunity for improvement. The data point provided for each measure is the reading from the 75th percentile. This means that 3 out of 4 users would have experienced a better experience than the rating. The 4th would have experienced something worse.
What to do
Any project to optimize performance needs to be a good investment of time. To help answer that question you can use the dashboard in 2 ways.
Do you have enough traffic for the project to be valuable?
While everyone wants a lightning fast store, you still need traffic and users in order to sell anything. If the number of users per day is less than 100 we would recommend running a project to increase traffic first.
Is performance stopping people from buying?
Any metric that is not ‘Good’ is an area where you can improve user experience. Whether it's optimizing code, prioritizing image loading, or fine-tuning layouts. The web performance dashboard empowers you to make data-driven improvements.
You can discover strategies on how to solve common web performance problems using the resources below the dashboard. These should be applied to the most visited pages on your store. These are typically product, collection and home pages.
Access the report via:
- The admin menu for Analytics -> Reports -> Online Store Speed
- The admin menu for Online Store -> Themes -> Click-through the banner at the top of the page
Info
Want to dive deeper? Start with Shopify's performance blog here.
Summary
As a Shopify merchant, your store's performance is vital, but you're equipped to make meaningful improvements. The performance dashboard offers actionable insights based on real user data, replacing outdated metrics with Google's Core Web Vitals for better accuracy.
While lower scores may seem daunting, they're opportunities for enhancement. With a proactive approach, you'll navigate challenges and unlock your store's full potential. You've got this!